See what your team can do, at a glance
A blueprint is a map of the capabilities that matter to you. Every tile fills in from assessment scores, for one person or the whole team, so strengths and gaps are obvious in a second.
Where is the team actually strong?
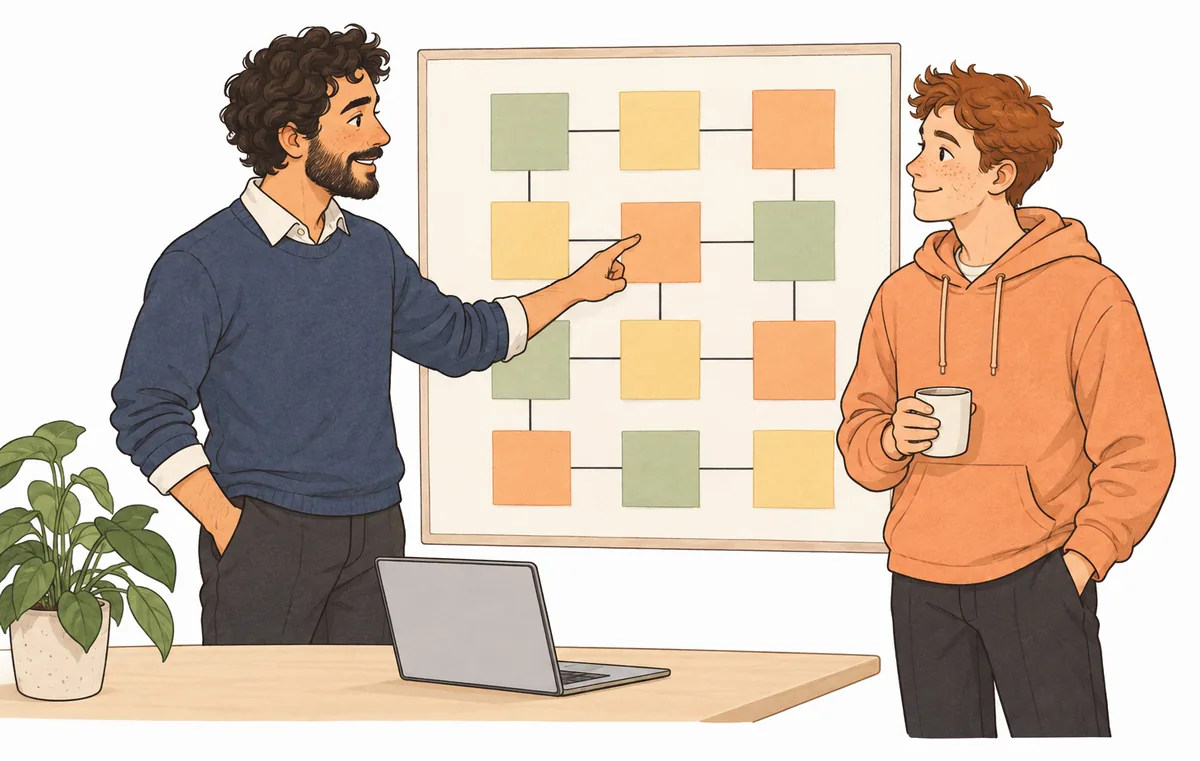
A living map of what your team can do.
Team capability check
Leaders see the whole team and each department. Nobody sees one person's answers.
Team map
Where to focus as a team
- 1
Close the tools gap
List what people are missing and sort by how often it slows them down.
- 2
Get the data in one place
Pick the three reports people ask for most and make them self-serve.
- 3
Fix the process first
Find the workarounds people rely on and remove the need for them.
They get:
A clear picture of how their team compares, without anyone being singled out.
You learn:
Where the whole team is strong, where it's thin, and which departments need help.
A map that fills itself in
Draw your framework once
Lay the map out the way your framework works: a grid of capabilities, a process flow or a cycle. Link each tile to part of an assessment and set what counts as strong.
- Grid, flow or flywheel
- Your own colours and thresholds
- Translate it for every team

See the whole team, then split it
Build the map from everyone who has answered. Split it by department, role or company size, with the widest gap first.
- A whole-team view from real responses
- Compare departments, roles or company sizes
- Groups under three people are never shown

One map, in every team's language
Share any map by link, and translate it so every team reads it in their own language. Every new response keeps it current.
- Share any map by link
- Translate the whole map, tile by tile
- Updates as new responses arrive
Make capability visible
Turn your framework into a map that keeps itself up to date.